Note frequency chart: every note from C0 to B8.
A note's frequency is 440 × 2(n − 69)/12 Hz, where n is the MIDI note number. C4 is 261.63 Hz, A4 is 440.00, C5 is 523.25, and each octave doubles, so the whole table is twelve numbers repeated eight times. The chart assumes A4 = 440 Hz and exact octaves. Measured against audio: a synthesised tone lands within 0.21 cents of the chart, a real piano recording sits +8.3 to +14.9 cents above it, and the same piano note moves by up to 4.9 cents depending on where in the note you measure — that instrument is tuned to A4 ≈ 442.91 Hz.
261.63 Hz — C4, MIDI note 60, at A4 = 440 Hz.
One anchor, twelve steps, then double
The table is not measured, it is computed. Pick one anchor — A4 = 440 Hz — and step in semitones of a factor of 21/12 ≈ 1.059463. Twelve of those steps multiply to exactly 2, which is why every octave is a doubling and why the same twelve numbers reappear one row down.
That structure is why the chart only needs twelve values, not a hundred and eight. C4 is 261.63; C5 is that doubled, 523.25; C6 is doubled again, 1046.50. If you remember the row for octave 4 and the rule "double per octave", you can rebuild the rest — the full table below is there so you do not have to.
The formula in one line: f = 440 × 2(n − 69)/12, with n the MIDI note number (C4 = 60, A4 = 69, C8 = 108). Going the other way, n = 69 + 12 × log2(f / 440), which is what a converter does when it names the frequency it heard.
C0 to B8, at A4 = 440 Hz
Hertz, two decimals, equal temperament. Read across a row for one octave, down a column for one note class.
| Octave | C | C♯ | D | D♯ | E | F | F♯ | G | G♯ | A | A♯ | B |
|---|---|---|---|---|---|---|---|---|---|---|---|---|
| 0 | 16.35 | 17.32 | 18.35 | 19.45 | 20.60 | 21.83 | 23.12 | 24.50 | 25.96 | 27.50 | 29.14 | 30.87 |
| 1 | 32.70 | 34.65 | 36.71 | 38.89 | 41.20 | 43.65 | 46.25 | 49.00 | 51.91 | 55.00 | 58.27 | 61.74 |
| 2 | 65.41 | 69.30 | 73.42 | 77.78 | 82.41 | 87.31 | 92.50 | 98.00 | 103.83 | 110.00 | 116.54 | 123.47 |
| 3 | 130.81 | 138.59 | 146.83 | 155.56 | 164.81 | 174.61 | 185.00 | 196.00 | 207.65 | 220.00 | 233.08 | 246.94 |
| 4 | 261.63 | 277.18 | 293.66 | 311.13 | 329.63 | 349.23 | 369.99 | 392.00 | 415.30 | 440.00 | 466.16 | 493.88 |
| 5 | 523.25 | 554.37 | 587.33 | 622.25 | 659.26 | 698.46 | 739.99 | 783.99 | 830.61 | 880.00 | 932.33 | 987.77 |
| 6 | 1046.50 | 1108.73 | 1174.66 | 1244.51 | 1318.51 | 1396.91 | 1479.98 | 1567.98 | 1661.22 | 1760.00 | 1864.66 | 1975.53 |
| 7 | 2093.00 | 2217.46 | 2349.32 | 2489.02 | 2637.02 | 2793.83 | 2959.96 | 3135.96 | 3322.44 | 3520.00 | 3729.31 | 3951.07 |
| 8 | 4186.01 | 4434.92 | 4698.64 | 4978.03 | 5274.04 | 5587.65 | 5919.91 | 6271.93 | 6644.88 | 7040.00 | 7458.62 | 7902.13 |
The row for octave 4 is the one worth knowing: C4 261.63, E4 329.63, G4 392.00, A4 440.00, C5 523.25. Those are the numbers behind an A major triad and the numbers a guitar tuner shows.
The chart is exact; an instrument is not
The site has two kinds of source material: a synthesised test tone and a recording of a real piano. Measuring the fundamental of each note in both, and comparing with the chart above, separates what the table promises from what an instrument delivers. Each note is measured in the five windows where it is loudest, and the median is reported.
| Note | Chart (Hz) | Synthesised tone (Hz) | Real piano (Hz) | Piano vs chart |
|---|---|---|---|---|
| C4 | 261.63 | 261.599 | 262.886 | +8.29 cents |
| E4 | 329.63 | 329.622 | 331.316 | +8.83 cents |
| G4 | 392.00 | — | 394.789 | +12.27 cents |
| C5 | 523.25 | — | 527.782 | +14.93 cents |
| E5 | 659.26 | — | 663.878 | +12.08 cents |
| G5 | 783.99 | — | 789.467 | +12.05 cents |
| A3 | 220.00 | 220.022 | — | — |
| D4 | 293.66 | 293.653 | — | — |
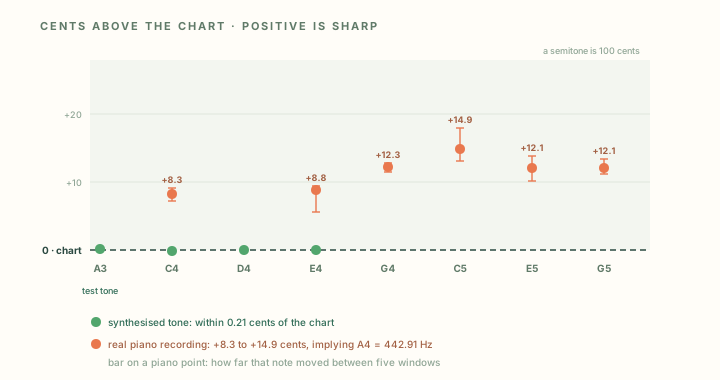
The four notes of the synthesised tone land within 0.21 cents of the chart — which is what you would expect, because that signal was generated from the same arithmetic. The piano does not. Its six measured notes sit between +8.29 and +14.93 cents, and each of them implies a slightly different A4: 442.12, 442.25, 443.14, 443.81, 443.09 and 443.07 Hz, averaging 442.91 Hz. The instrument is not in tune with the chart; it is in tune with itself, about 11.4 cents sharp of A4 = 440.
There is a second difference, and it matters more than the first. Measure the same piano note in five different windows of the same recording and the answer moves: C5 reads between +13.09 and +17.95 cents, a 4.86-cent span, and no note moves by less than 1.3 cents. A piano note is not one frequency while it sounds: the reading moves by up to 4.86 cents inside a single note. Why it moves is not something this recording settles. My own reading of the numbers above is that the strings of a piano unison are not tuned to exactly the same frequency and beat against one another as the note decays — but that is an inference, not a measurement, and nothing on this page proves it. The synthesised tone barely does this: its five windows agree to within 1.1 cents. So the chart's two decimals are a promise about arithmetic, and a piano can miss that promise by 15 cents while still being a well-tuned piano.
This is the honest reading of any frequency chart: the numbers are a reference grid, not a description of the audio in front of you. If you are matching a synth to a recording, the recording's own A4 is the number you need, and it has to be measured — the chart cannot supply it.
What the chart promises about the gaps
A frequency chart is usually read for single notes, but its real content is the spacing. In equal temperament every semitone is 100 cents and every octave exactly 1200, which is a compromise: the ratios that occur naturally in a vibrating string are not these. The differences are small and fixed, and they are arithmetic, not opinion.
| Interval | Just ratio | Just (cents) | Equal temperament | Equal temperament − just |
|---|---|---|---|---|
| Minor third | 6:5 | 315.64 | 300.00 | −15.64 |
| Major third | 5:4 | 386.31 | 400.00 | +13.69 |
| Perfect fourth | 4:3 | 498.04 | 500.00 | +1.96 |
| Perfect fifth | 3:2 | 701.96 | 700.00 | −1.96 |
| Octave | 2:1 | 1200.00 | 1200.00 | 0.00 |
The same measurement on the piano recording shows how far a real instrument's spacing can sit from the chart's promise: C4 to E4 measures 400.52 cents against the chart's 400.00, E4 to G4 measures 303.45 against 300.00, and C4 to C5 measures 1206.61 against 1200.00 — an octave 6.61 cents wider than the table says. A stretched octave is the usual explanation in piano tuning; the recording alone cannot prove that is what happened here, so treat the explanation as an inference and the 6.61 cents as the measurement.
Questions about note frequencies
What is the frequency of C4?
261.63 Hz at A4 = 440 Hz. One octave up, C5, is 523.25; one down, C3, is 130.81. Each C is the one below it doubled, give or take the last digit: 261.63 × 2 = 523.26, and the chart prints 523.25 because every cell is rounded to two decimals.
Why is A4 the reference instead of C4?
Because 440 Hz for A4 is the tuning standard (ISO 16) and the formula is written around MIDI note 69, which is A4. The anchor could have been any note; changing it changes every number in the table by the same ratio, not the intervals between them.
How many hertz is one semitone?
It is not a fixed number of hertz — it is a fixed ratio, 21/12 ≈ 1.059463. At A3 (220 Hz) one semitone is about 13 Hz; at A5 (880 Hz) the same semitone is about 52 Hz. That is why charts are read in ratios or cents rather than in hertz differences.
Does the chart change if the recording is tuned to 442?
Yes, every value scales by 442/440 = 1.004545. A4 becomes 442.00 and C4 becomes 262.82 instead of 261.63 — a difference of about 7.9 cents across the whole table. Which reference applies is a property of the recording, not of the note.
Why does a real piano not match the chart exactly?
Because a piano is tuned to itself, not to a table: on the recording measured here, each note implied a slightly different A4, the octave came out 6.61 cents wide, and measuring one note in five windows moved it by up to 4.86 cents. A chart is the grid you compare against, not a claim about any particular instrument.
Can a MIDI file tell me the frequency of a note?
Only if you supply the reference. The file stores note numbers, not hertz; 69 becomes 440 only after you apply A4 = 440. Read the number from the file, then convert it with the formula above — see what concert pitch means for why the reference is a convention rather than a property of the file.